I recently found out about a competition being held in Australia, by the
Government 2.0 Taskforce called Mashup Australia. This taskforce, as taken from their Terms of reference.
will advise and assist the Government to:
- make government information more accessible and usable — to establish a pro-disclosure culture around non-sensitive public sector information;
- make government more consultative, participatory and transparent — to maximise the extent to which government utilises the views, knowledge and resources of the general community;
- build a culture of online innovation within Government — to ensure that government is receptive to the possibilities created by new collaborative technologies and uses them to advance its ambition to continually improve the way it operates;
- promote collaboration across agencies with respect to online and information initiatives — to ensure that efficiencies, innovations, knowledge and enthusiasm are shared on a platform of open standards;
- identify and/or trial initiatives that may achieve or demonstrate how to accomplish the above objectives.
The Mashup Australia competition was created to emphasis this and provide a practical demonstration of the benefits of opening up sets of their data.
There was quite a large amount of data sets available albeit some not exactly in the most usable format. It was a great way to make the public aware that this data exists, and for us as developers to have fun with how this data could be presented.
I spent a few days on a couple of entries, using flex and flash for the UI. It would have been nice to have a bit more time to test them and to add a few more bells and whistles.
1. 
The first idea I had was called the GCI PhotoHUB. Because a number of Government Cultural Institutions publish their photographs onto flickr I thought it would be nice to have a central application to be able to search/view these common image sets.
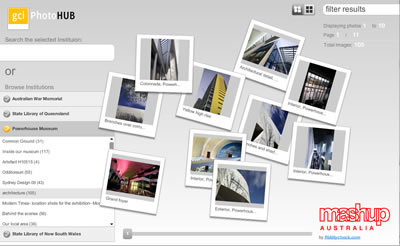
I used the neat as2flickrlib API however I did realise that the commons API was not included in the lib so I had to write one myself for getting that particular piece of information.
I wanted to create something that was intuitive for the end user and something a little playful for them to interact with.
This is the entry here
2. 
The second idea was to create more visually digestible way to display crime statistics in Australia. I chose a number of methods for this which included primarily a map overlay, secondary – charting components, thirdly – a raw data set. I felt that this would give the end user 3 options depending on what they felt comfortable with.
The initial UI was changed slightly after working through some UX concepts from a good friend of mine who works as a UX consultant.
There were a number of design cues including the map indicators taking reference from police lights as well as the font chosen for the map overlay to help with the overall theme.
The data set provided was in the form of an xls document. Because .xls documents aren’t exactly the best format for web applications. I created a webservice to read the xls file and serve up the data as both a ColdFusion query set as well as a call to return XML. Making the data much more useful for both Flex and potentially other developers eventually.

This is the entry for crimewave here
Both these apps were built in quick time so I’m sure there will be a couple of bugs crawling around 🙂 so if you find one feel free to let me know. Overall it was a fun way to utilise this newly exposed data from the Government and even a better way to expose it using Flex as the tool.